From within your analytics dashboard you will be provided with powerful engagement metrics such as:
High Level Analytics
The top bar within your analytics dashboard provides the following:
Page Views
- How many people land on your page.
Scratched
- The number of people who have begun scratching on your page.
Finished
- The number of people who have hit enough interaction points for your CTA button to appear.
Redeemed
- The number of people who click on your CTA button upon completing the scratching experience.
Aggregate Time of Engagement
The aggregate amount of time users are interacting with your page. This information is tracked by using a triggered timer that begins counting as soon as users lands on the page. You can compare this aggregate time of engagement to that of commercials/video. By dividing your aggregate time by your # of “scratched” you can determine the average amount of time your users are interacting with your page.
[image - Waiting for Fix]
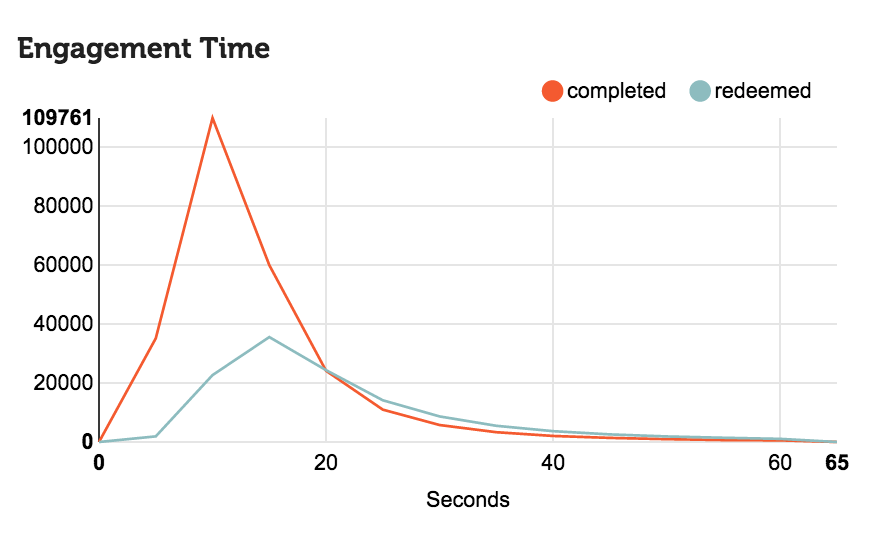
Engagement Time Funnel
This funnel, in the left hand corner of your analytics dashboard, collects the average amount of seconds users take to “scratch” or to press the “redeem” button.
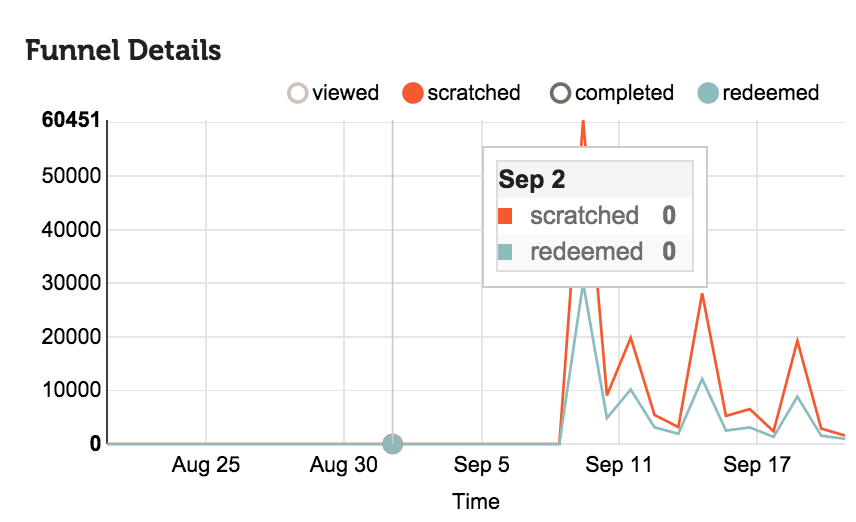
Funnel Details
Funnel details gives you the complete picture of your user's path as they land on and interact with your page.
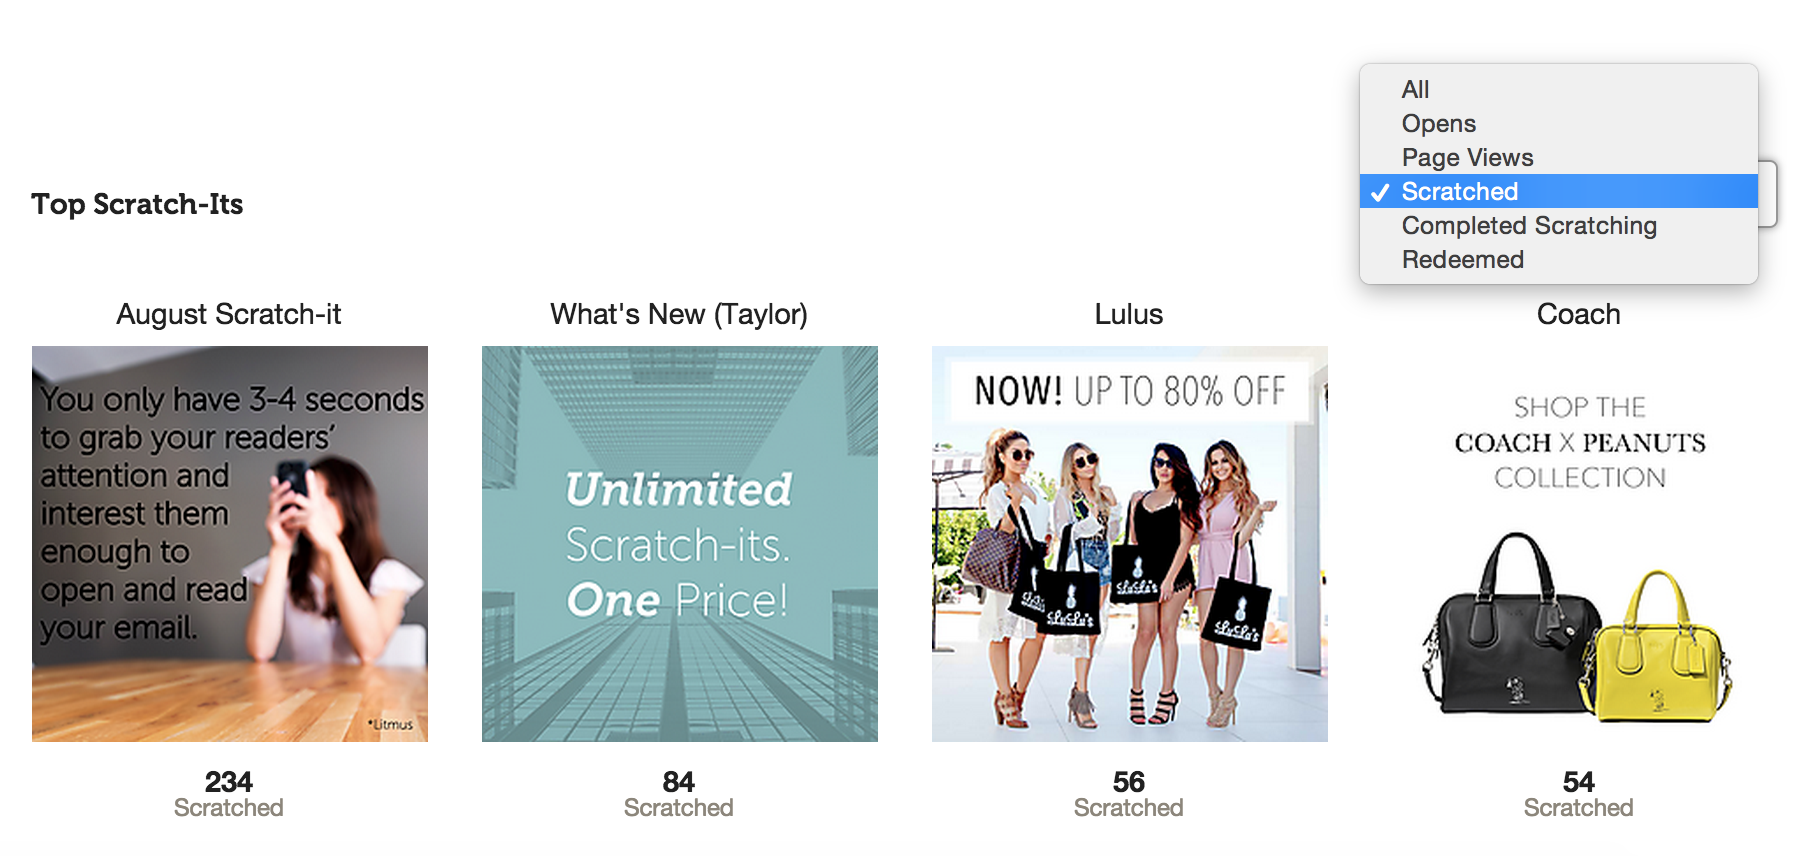
Top Scratch-its
View your most successful Scratch-its based on selected the interaction types.